1. Introduction
GBS SmartSense is a web app for monitoring GBDS clusters, allowing the user to view live reports on the environment’s health and performance.
This manual is updated for SmartSense version 1.2.4.
1.1. Access and Authentication
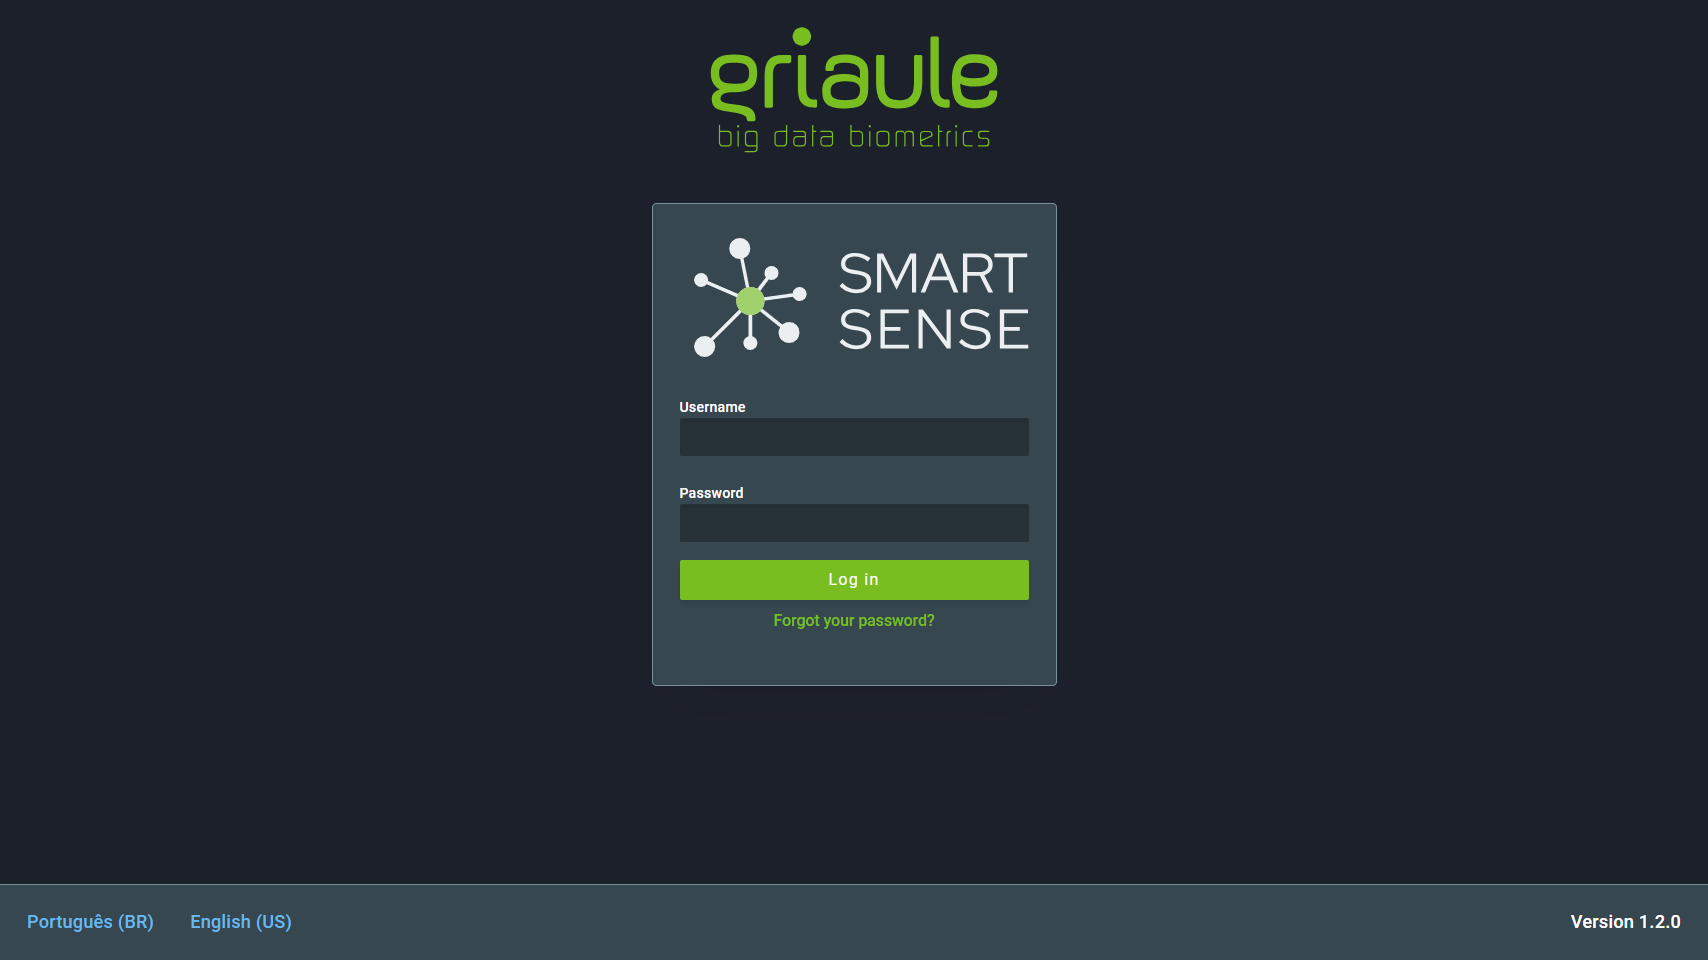
GBS SmartSense should be accessed with a web browser, and Google Chrome is recommended. The URL for access is specific to each deployment. If necessary, contact Griaule’s support team to obtain the correct URL.
Authentication is required to access the application. The credentials required by GBS SmartSense are username and password.
Note
At the bottom of the screen there is an option to change the user interface language. This option is also available at the settings after login.
1.2. Two-factor Authentication (2FA)
When two-factor authentication (2FA) is turned on, the first time you try to log in, after entering your username and password, you’ll be shown a QR Code that must be registered in Google Authenticator.
Note
Google Authenticator is a time-based code generator that is available as an application for Android and iOS smartphones.
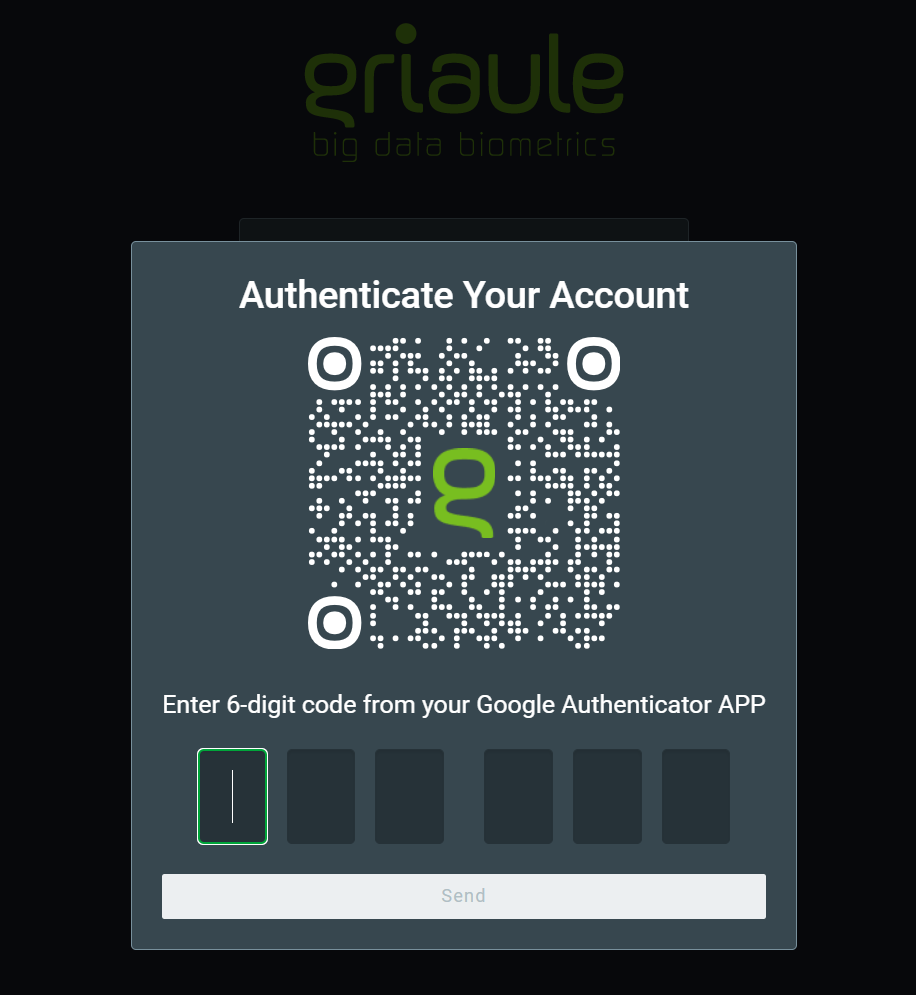
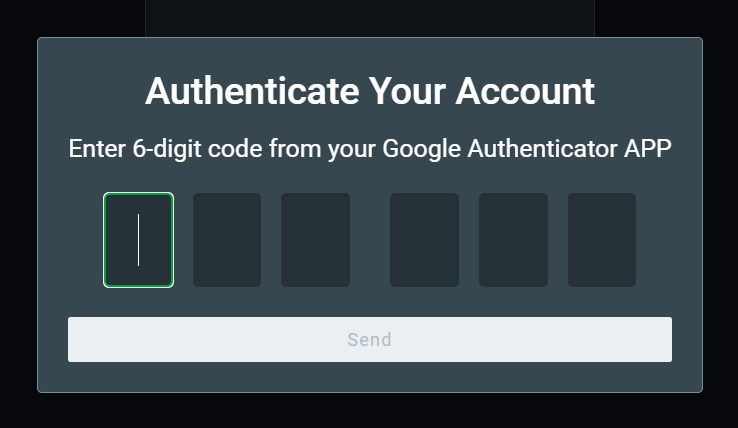
After successfully registering the QR Code in Google Authenticator, enter the unique time-sensitive 6-digit code and click on Send.
You will only need to register the QR Code once. But for each subsequent login, you will be asked to enter the 6-digit code generated by Google Authenticator.
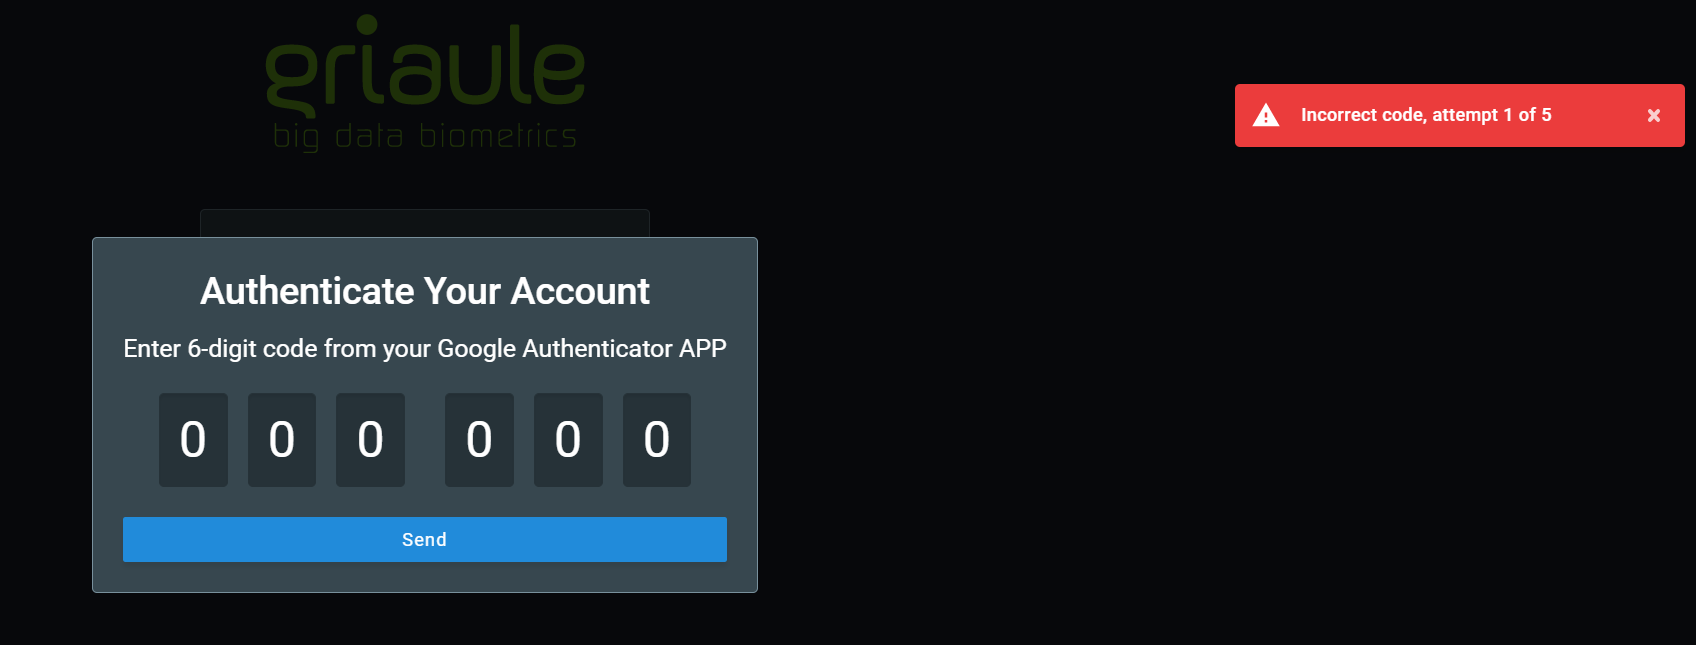
There is a limited number of unsuccessful login attempts a user can make. Every time an incorrect code is entered, an error message will be shown:
If you reach the maximum amount of unsuccessful login attempts, your account will be automatically blocked.
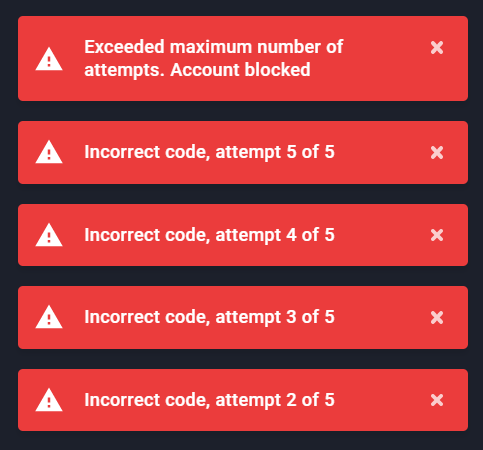
Warning
If your account is blocked, contact your system administrator.
1.3. Simultaneous Login and Browser Enrollment
Only one session per user is allowed. It is not possible to log in with the same profile more than once in the application. If an user is already logged in and another access happens using the same username and password, the user with the oldest session will be warned and logged out in their next action.
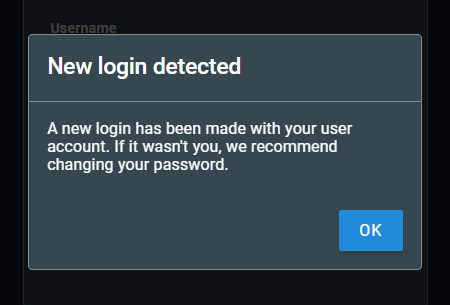
Also, only one browser may be used at a time. When trying to log in using a different browser, the user will be informed that it is necessary to authenticate the new browser. The authentication of a new browser will revoke the access from the previous one.
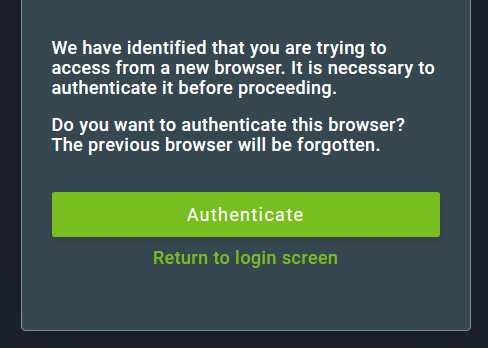
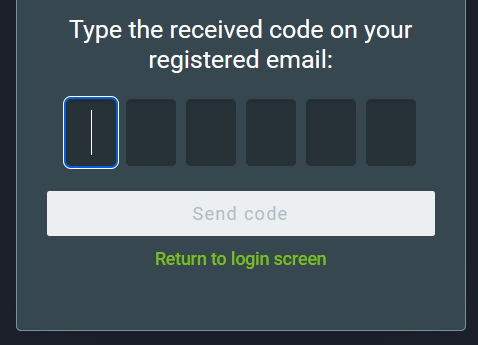
To authenticate a new browser, click on Authenticate and then enter the verification code that will be sent to the email linked to the user account.
If the authentication is successful, a notification will appear on the upper-right corner of the screen after logging in.

1.4. Reset your Password
You can reset your password if you forget it.
To reset your password, on the login screen, click on Forgot your password?:
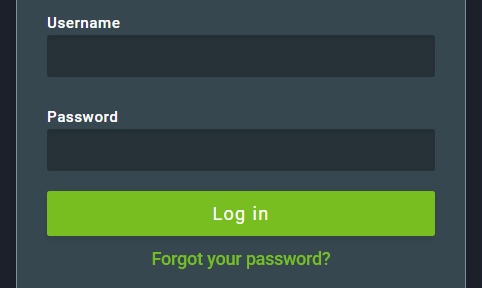
Then, enter the profile username and click on Send.
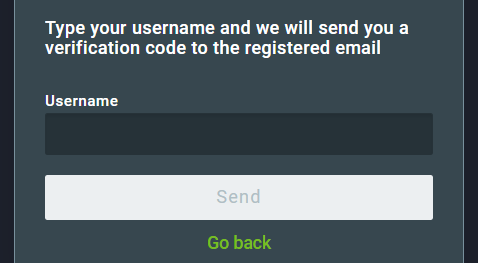
An email containing a verification code will be sent to the email address linked to that profile. Enter the verification code and click on Send code.
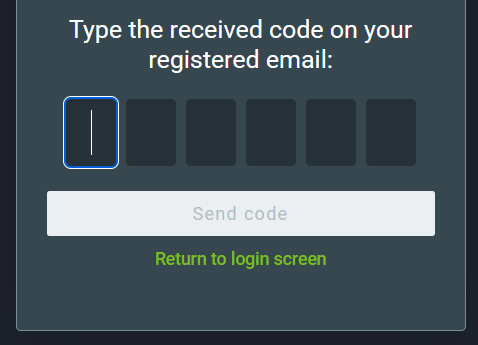
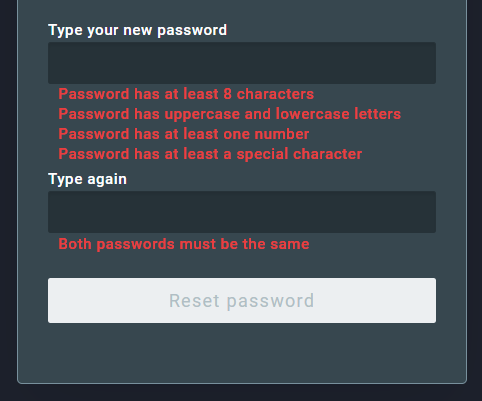
If the code is correct, you will be able to create a new password. Enter the new password two times. Make sure to meet the password requirements, they are listed under the new password field and will turn green when met. Finally, to confirm the reset, click on Reset password.
2. User Interface
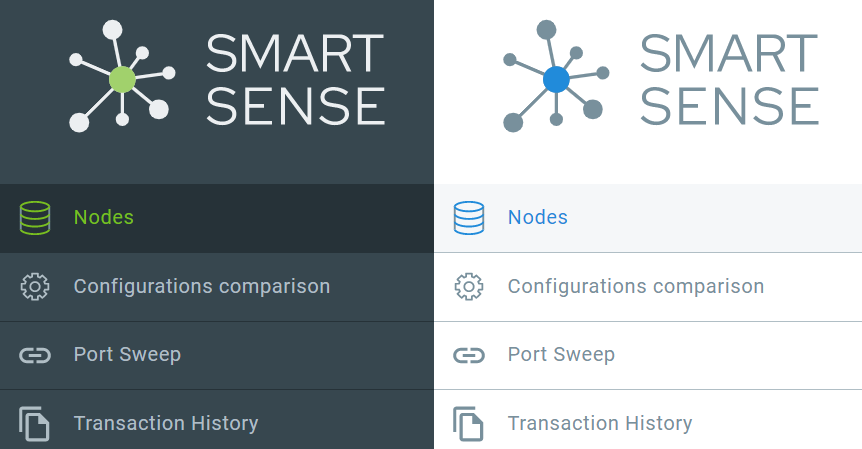
There are six screens that can be accessed using the sidebar: Node List, Configuration Comparison, Port Sweep, Transaction History, Queue, and Transactions List.

2.1. Node List
The Node List screen displays information on available storage space, RAM, temperature, number of matchers and status for each host/IP.
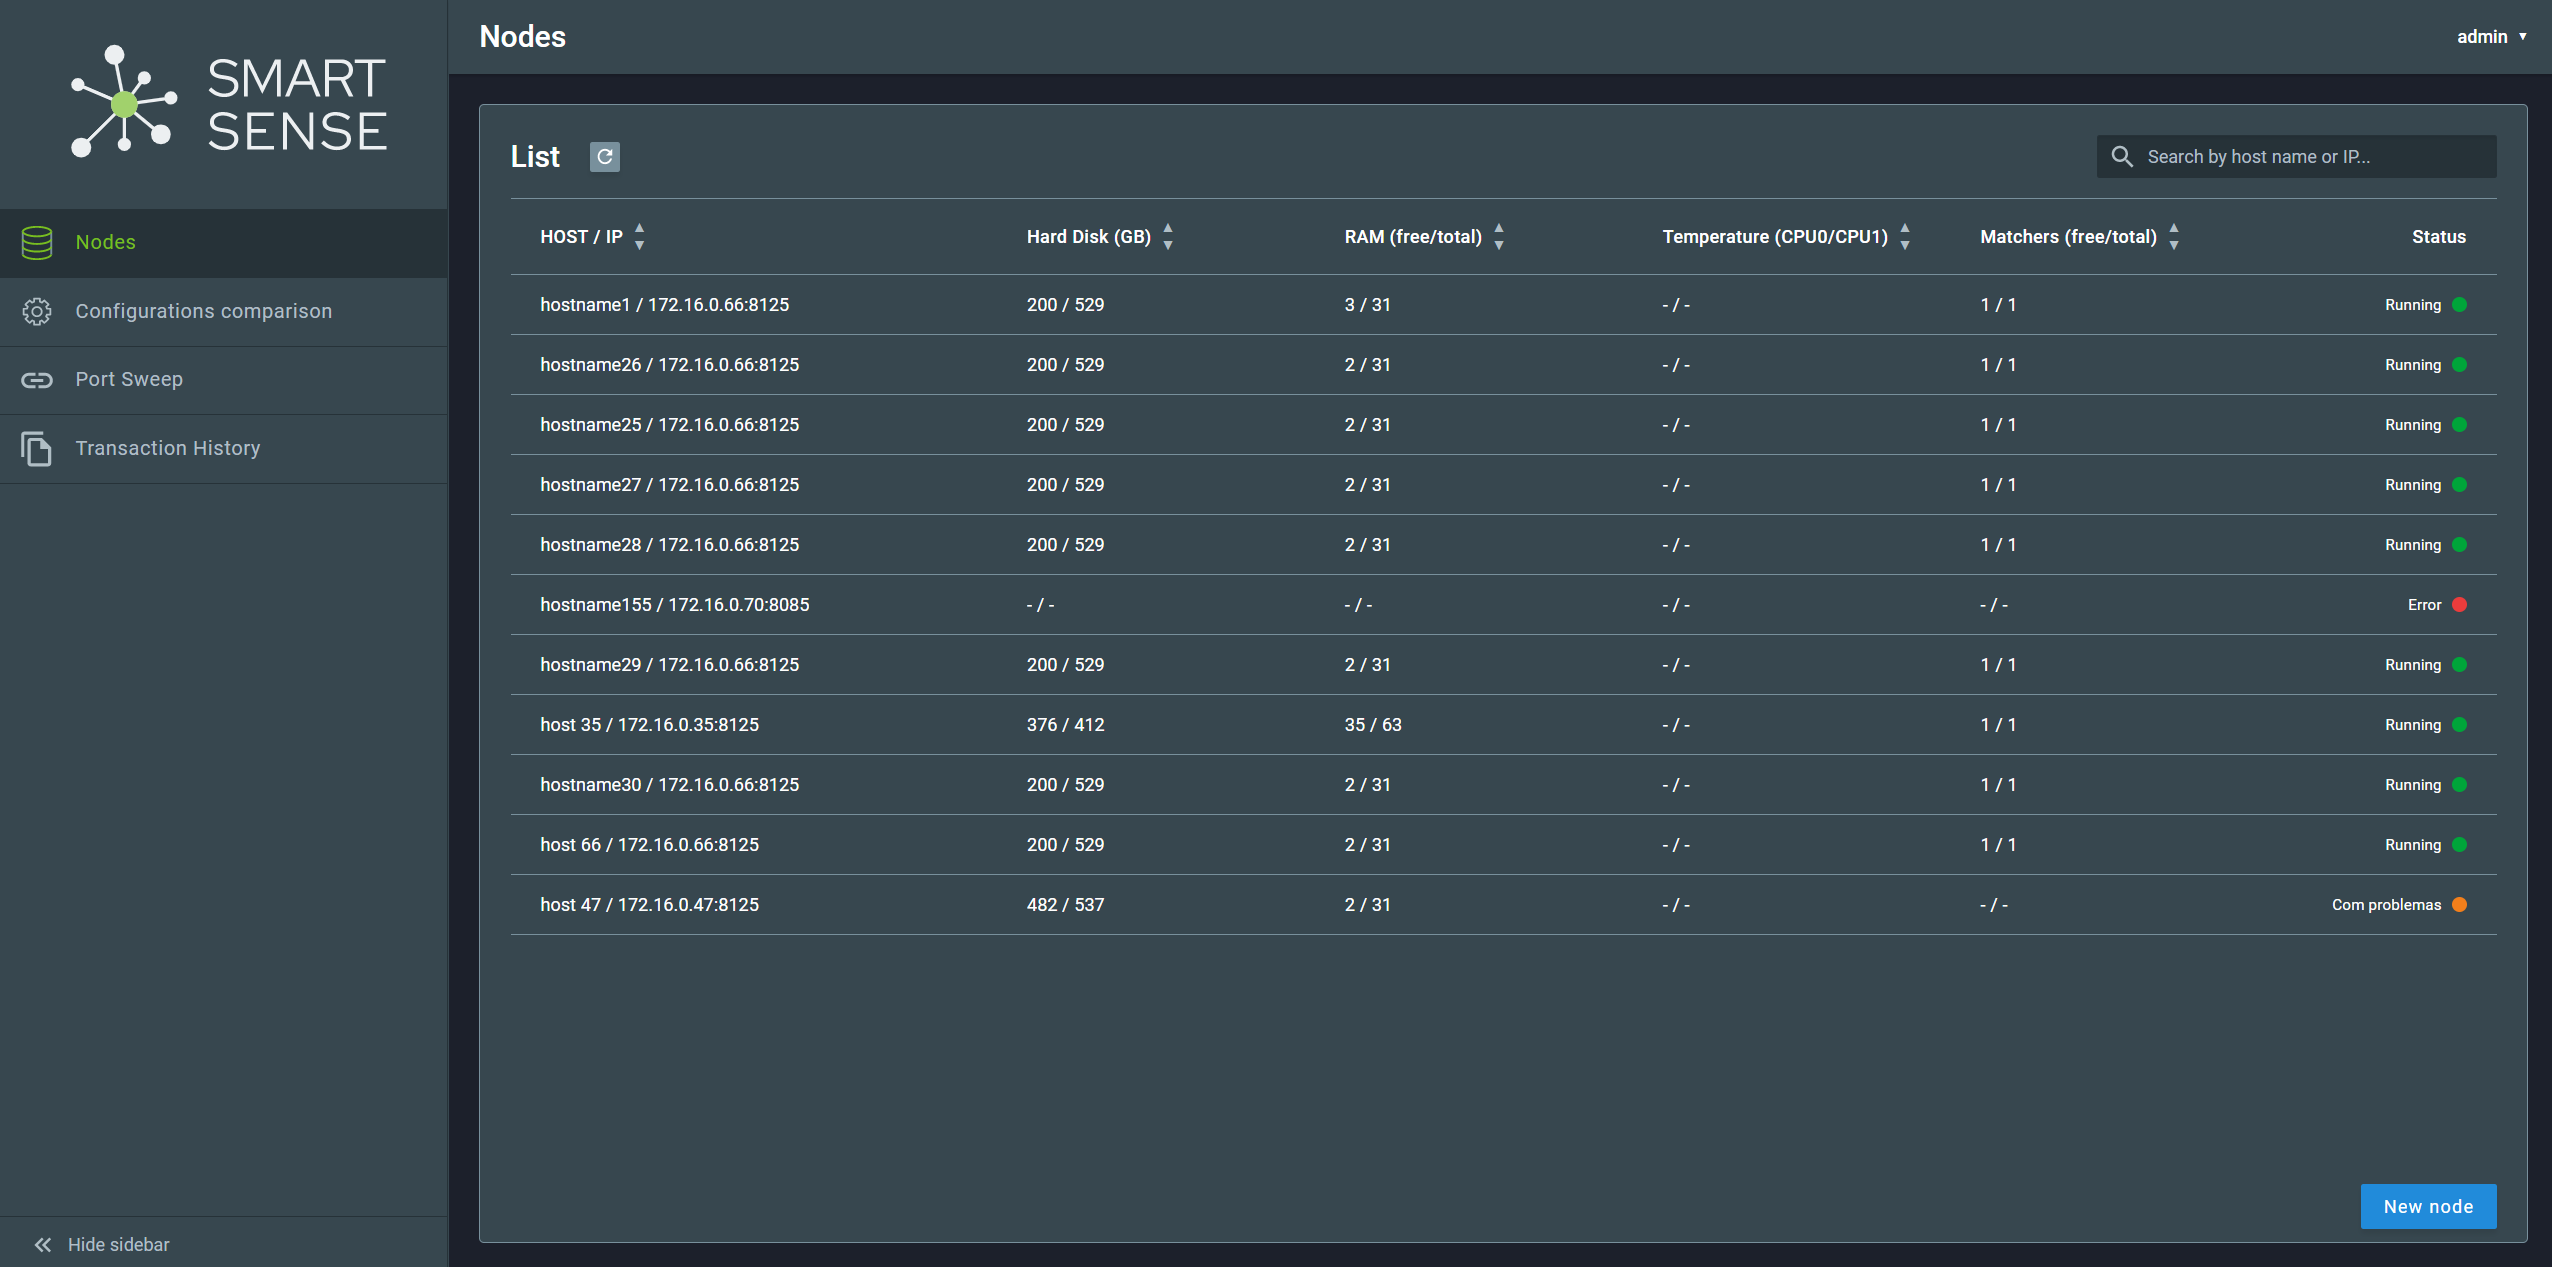
To refresh the displayed information, use the refresh button or reload the whole page pressing Ctrl/Command + R on the keyboard.
On the upper-right corner, it is possible to filter the displayed information by hostname or IP address:

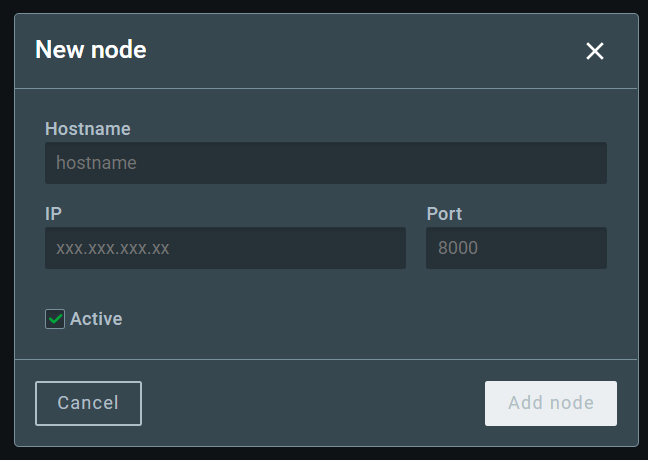
To create a new node without accessing the database directly, click on the New Node button on the lower-right corner. Enter the hostname, IP, and port. Then, check the box if it’s an Active node. Finally, click on Add Node.
The Active status means that the node will be analyzed and displayed on SmartSense.
Warning
The hostname identifies the node, so it must be unique. Attempting to create a new node with the same hostname of an existing one will overwrite the existing node.
2.1.1. Node Details
Click on an item of the Node List to open the Node Details screen, which displays detailed information about the services running on that node (Services tab) and its hardware resources (Resources tab). In both tabs, it’s possible to refresh the information displayed by clicking on the refresh button located on the upper-right corner of the screen.
2.1.1.1. Services Tab
The Services tab shows the services running on the node, their respective ports and their status.

2.1.1.2. Resources Tab
The Resources tab shows some hardware information of the node, such as disk usage, RAM usage, transmission rate, etc.

2.2. Configuration Comparison
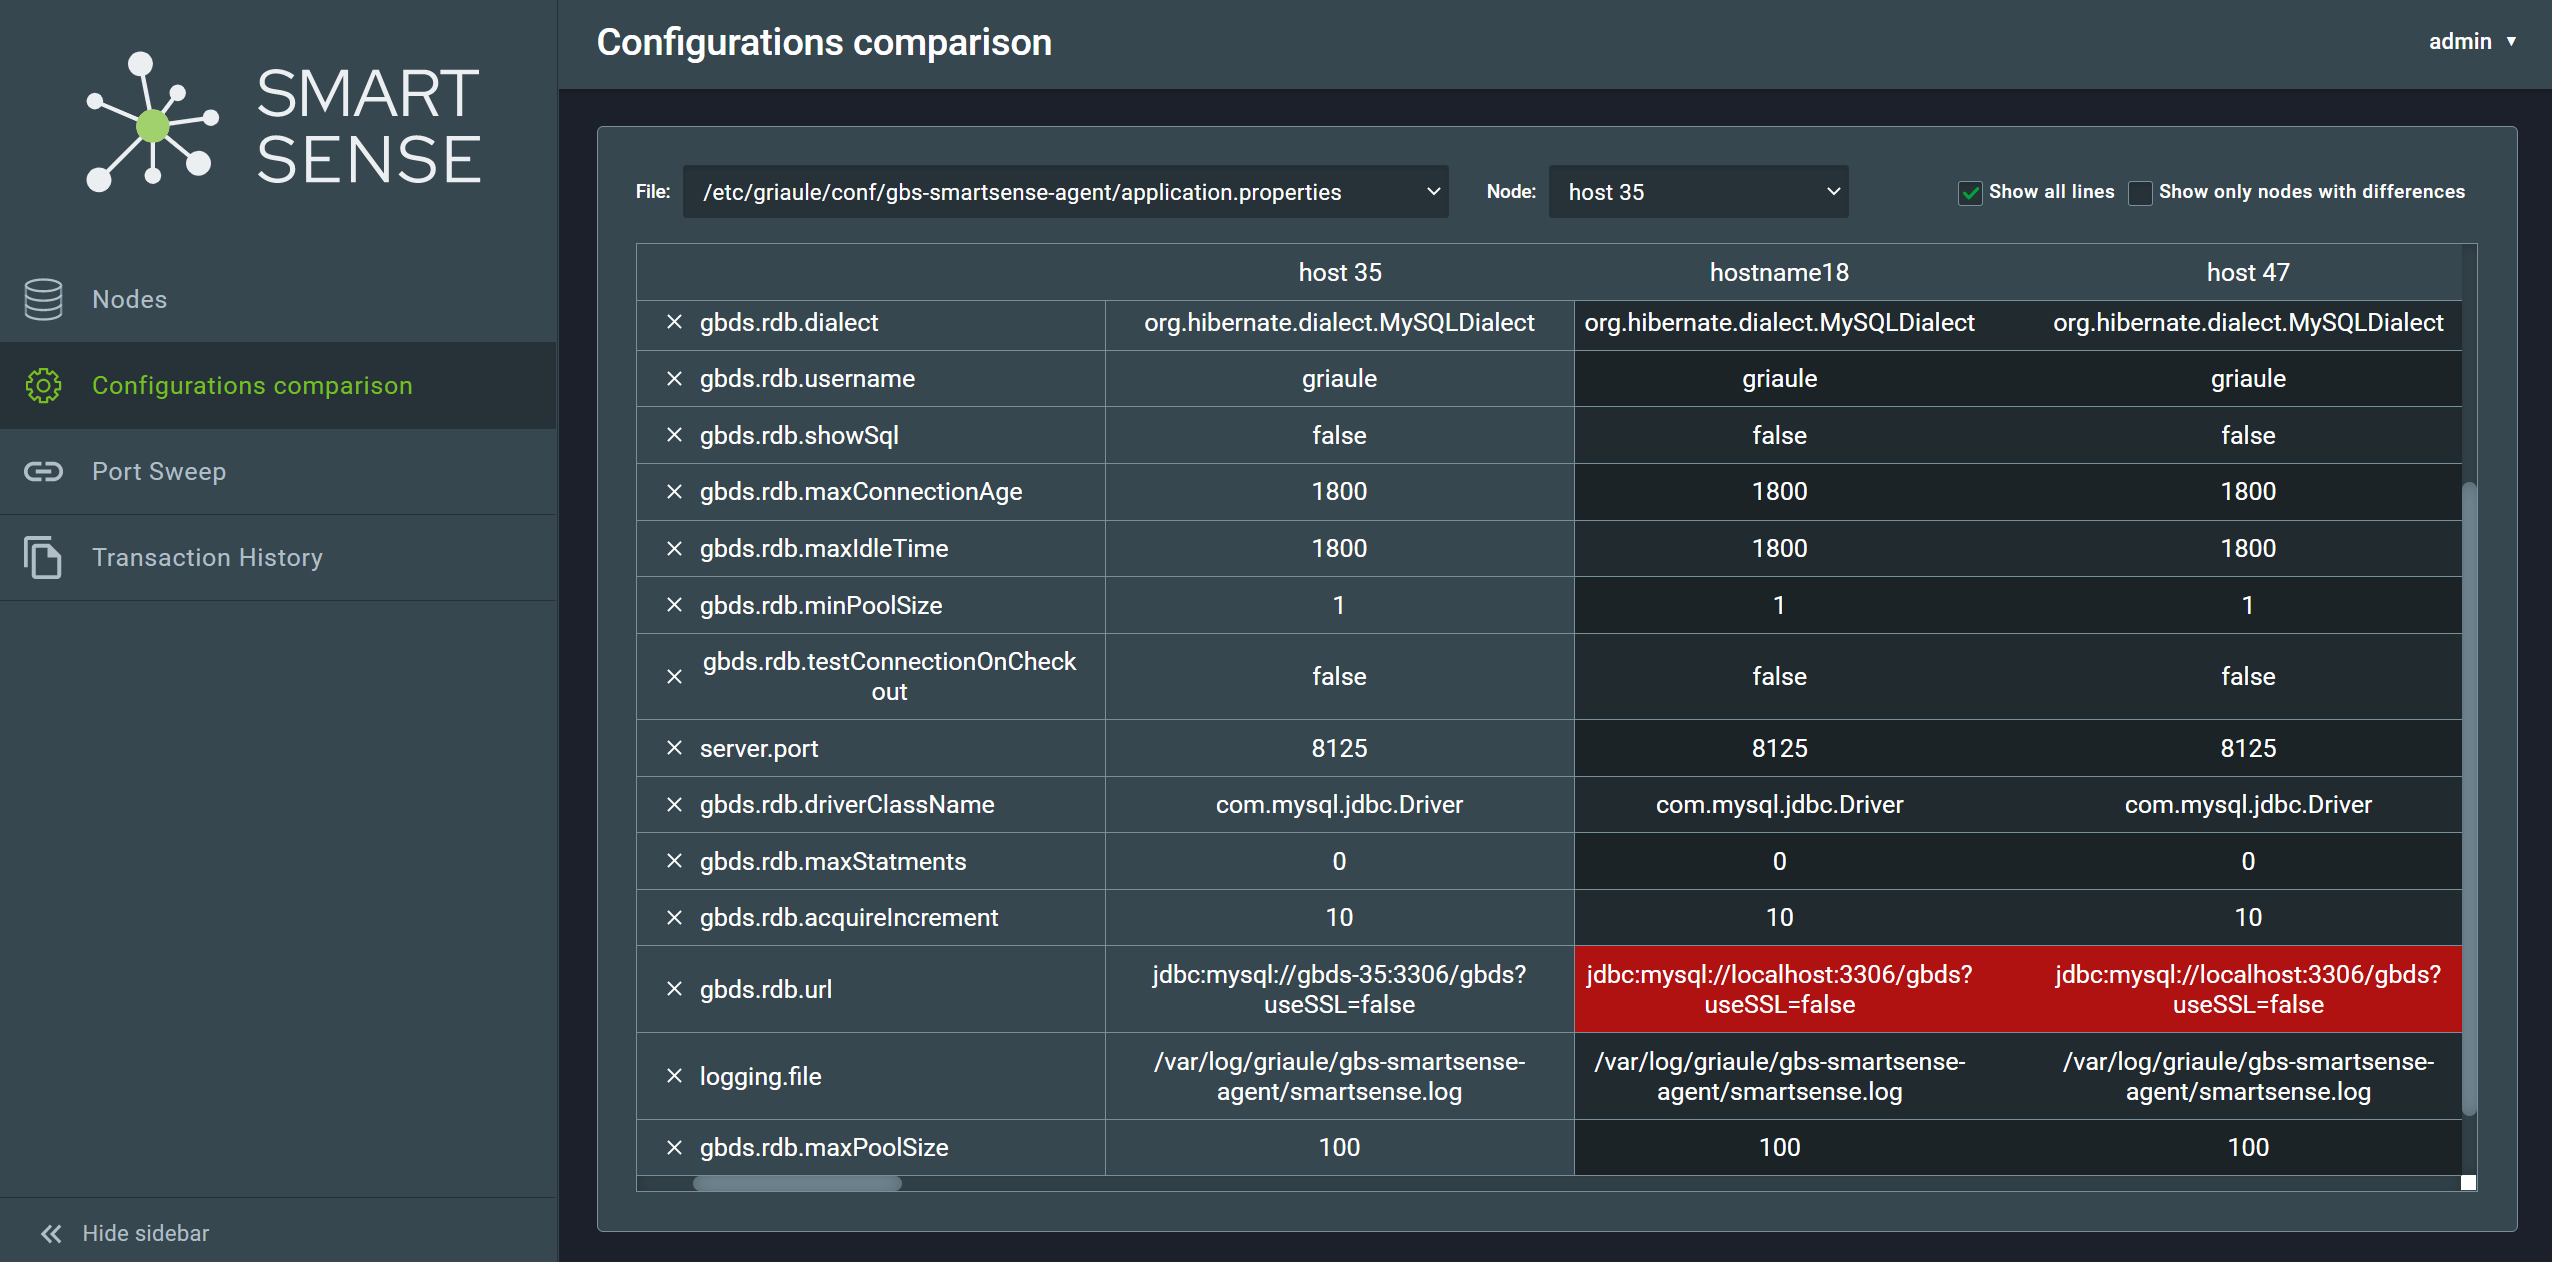
The Configuration Comparison screen allows the user to select a configuration file and a reference node to compare its configuration with all other nodes. The different configurations are shown in red.
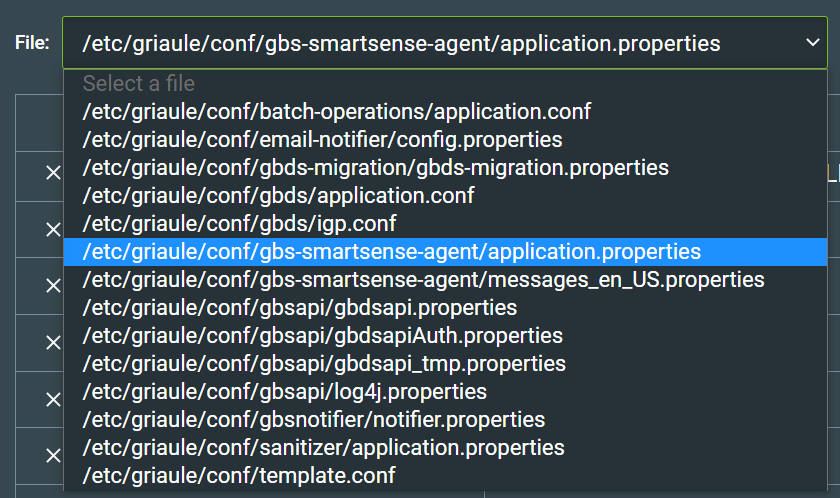
To select a configuration file, click on the dropdown menu and choose a file from the list.
Then, to select a node, click on the dropdown menu and choose a node from the list.
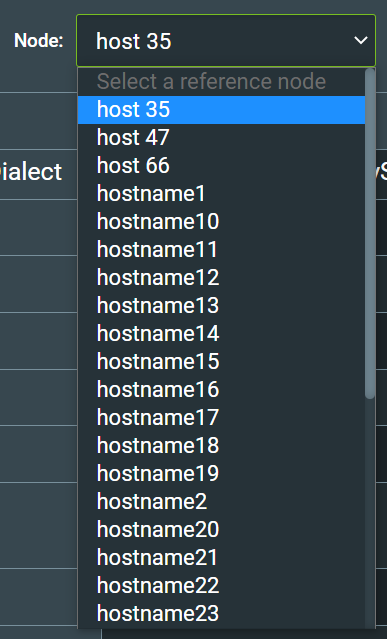
It is possible to remove rows from the list by clicking on the X at the left end of the row. This option will only hide the row from view, it will not affect any file.

To restore the original list with all the rows, check the box Show all rows.
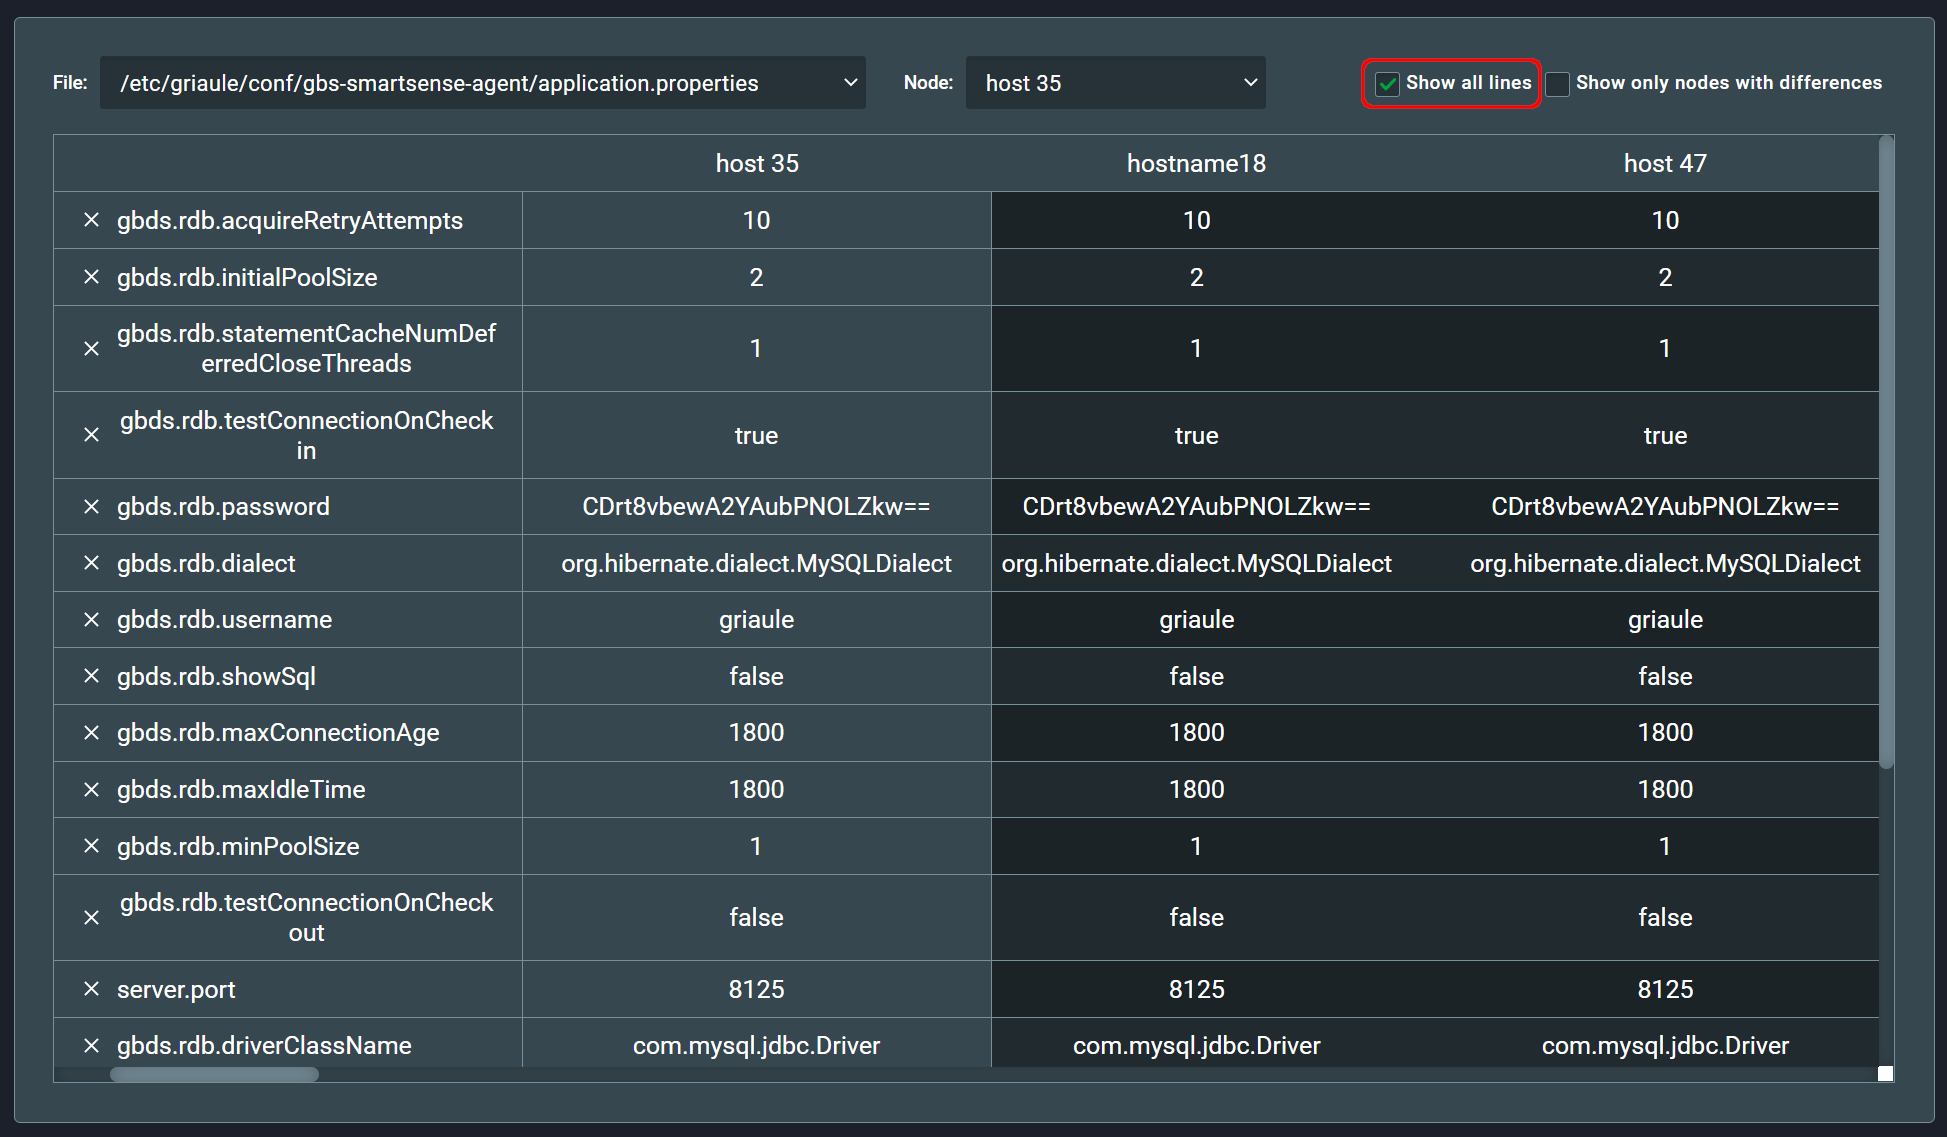
It is possible to filter the results and only show the columns with nodes that have a different configuration. To do that, check the box Only show nodes with differences.
2.3. Port Sweep
The Port Sweep screen allows the user to select an IP and specific ports to then perform a port sweep across all hosts and display the results on a table.
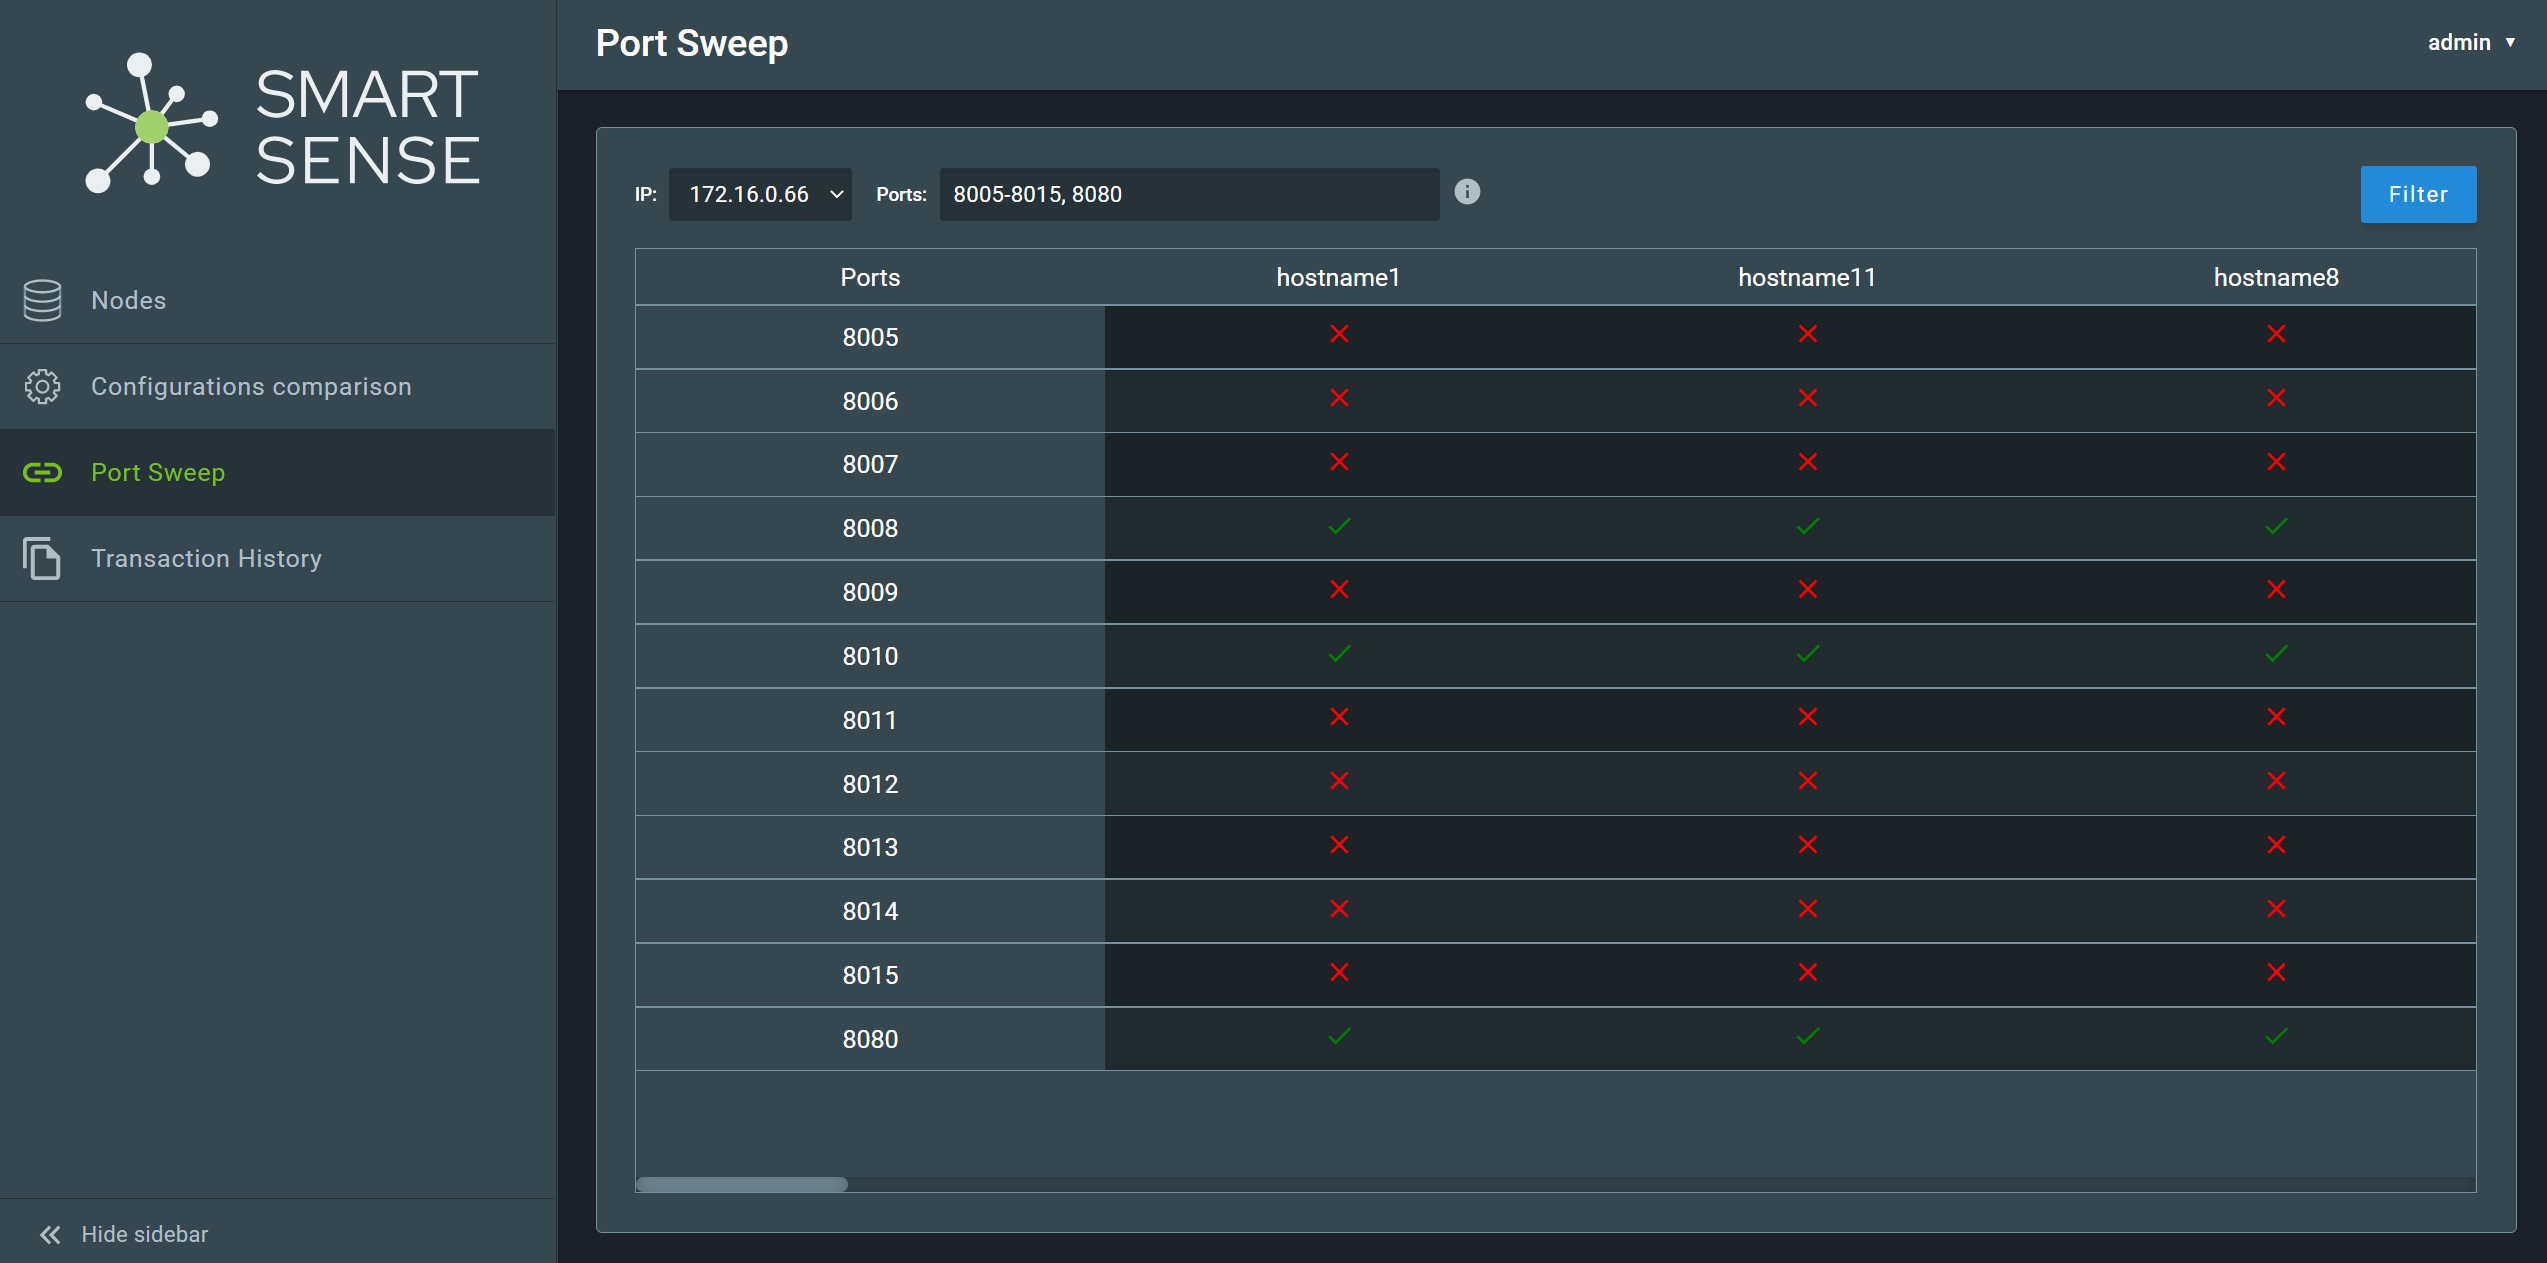
To select an IP, click on the dropdown menu and choose an IP address.
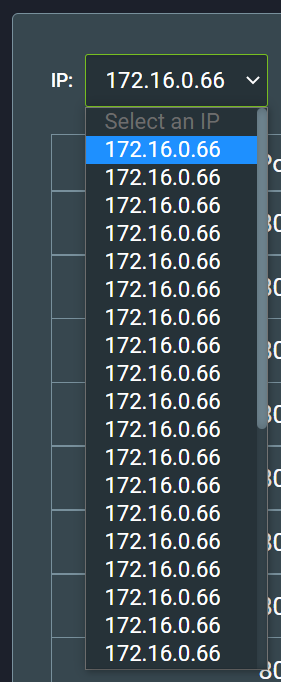
The ports can be selected as a list of individual ports separated by commas (e.g., 8000, 8080, 8125); as a range, with the upper and lower bounds separated by a dash (e.g., 8005-8015); or as a combination of both (e.g., 8005-8015, 8080).

After selecting an IP and ports, click on the Filter button, located on the upper-right corner of the screen to perform the port sweep.
2.4. Transaction History
The Transaction History screen shows usage histogram charts powered by Kibana. There are five tabs: Identify, Identify (Latent), Verify, Enroll, and Update. On each tab, it is possible to interact with the graph, for example, hover over a bar to show the number of operations or click and drag over some of the bars to zoom in. On the upper side of the chart, it is possible to add filters to customize the way the information is displayed.
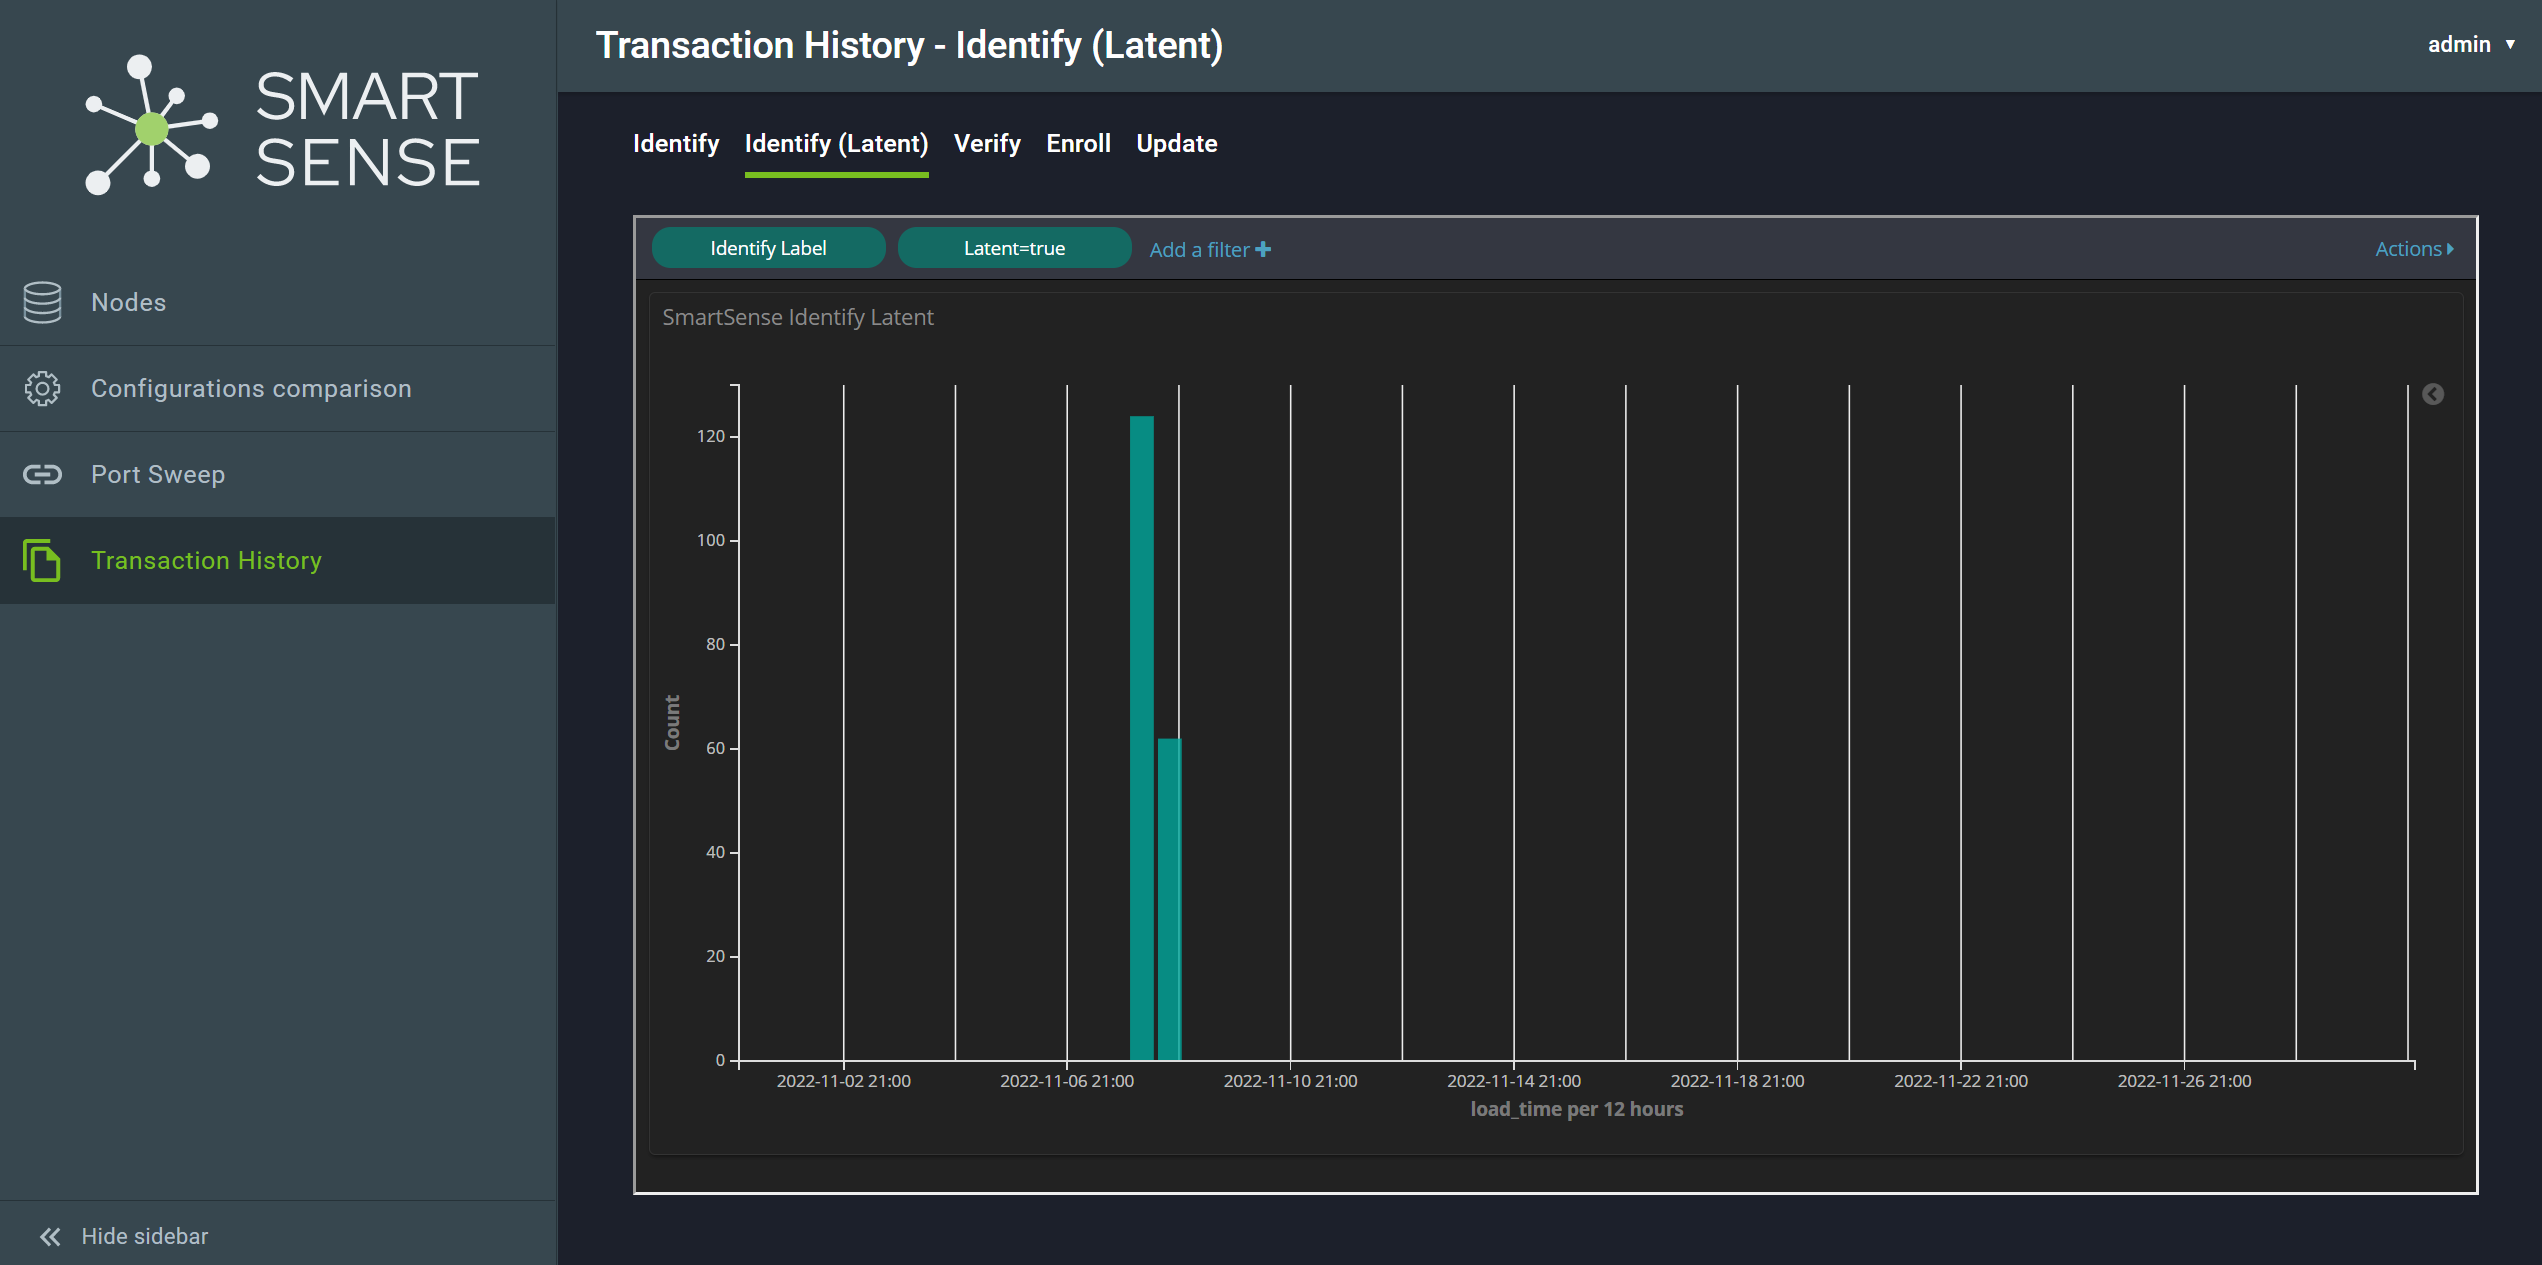
Attention
For this feature, it is necessary to have ELK installed and properly configured. Also, it is needed to have the following parameters in config.properties:
linkVerify=<link to Kibana dashboard>
linkIdentify=<link to Kibana dashboard>
linkIdentifyLatent=<link to Kibana dashboard>
linkEnroll=<link to Kibana dashboard>
linkUpdate=<link to Kibana dashboard>
2.5. Queue
The Queue screen shows the current queue of transactions listed by priority.
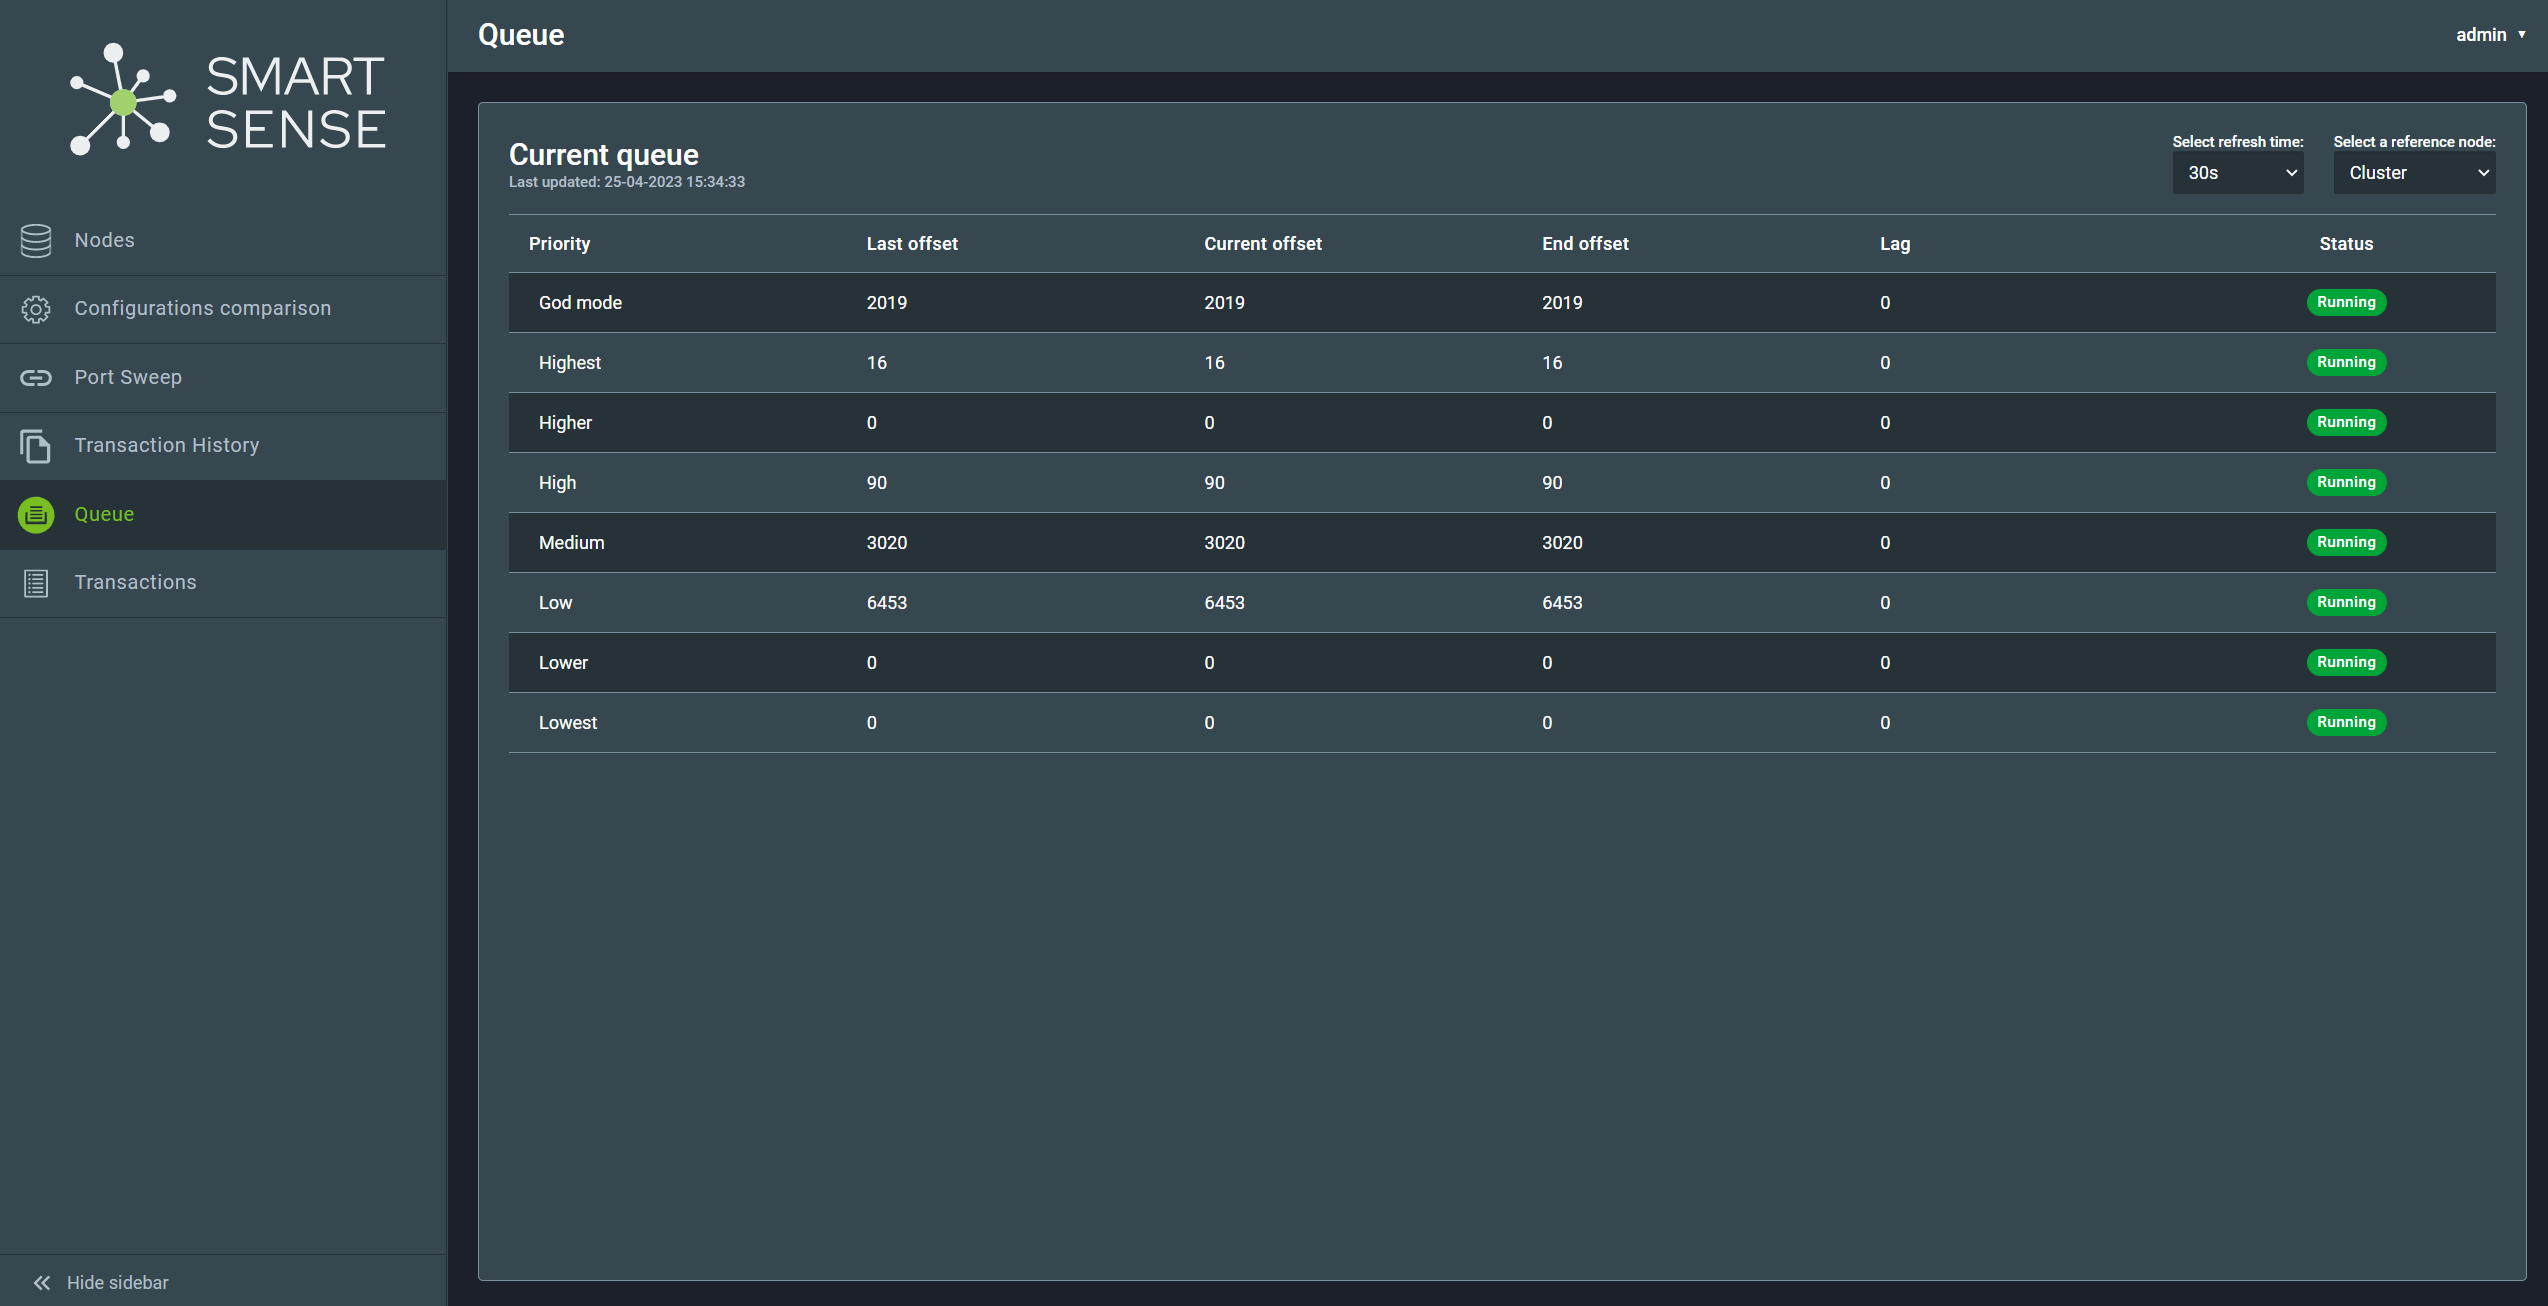
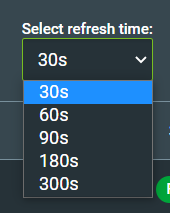
The list is continuously refreshed and the refresh time can be adjusted using the dropdown menu on the upper-right corner:
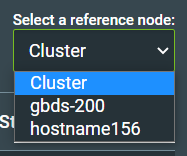
You can choose to show the queue for the entire cluster, or for a reference node. To choose a node, click on the dropdown menu on the upper-right corner of the screen and select a node:
2.6. Transactions List
The Transactions List screen displays a list of transactions processed in a given time period.
Upon opening the page, the transactions performed on the last hour of the current date will be displayed.
To show the transactions performed in a different time frame, select a date, a start time, and an end time. Then, click on the Filter button.
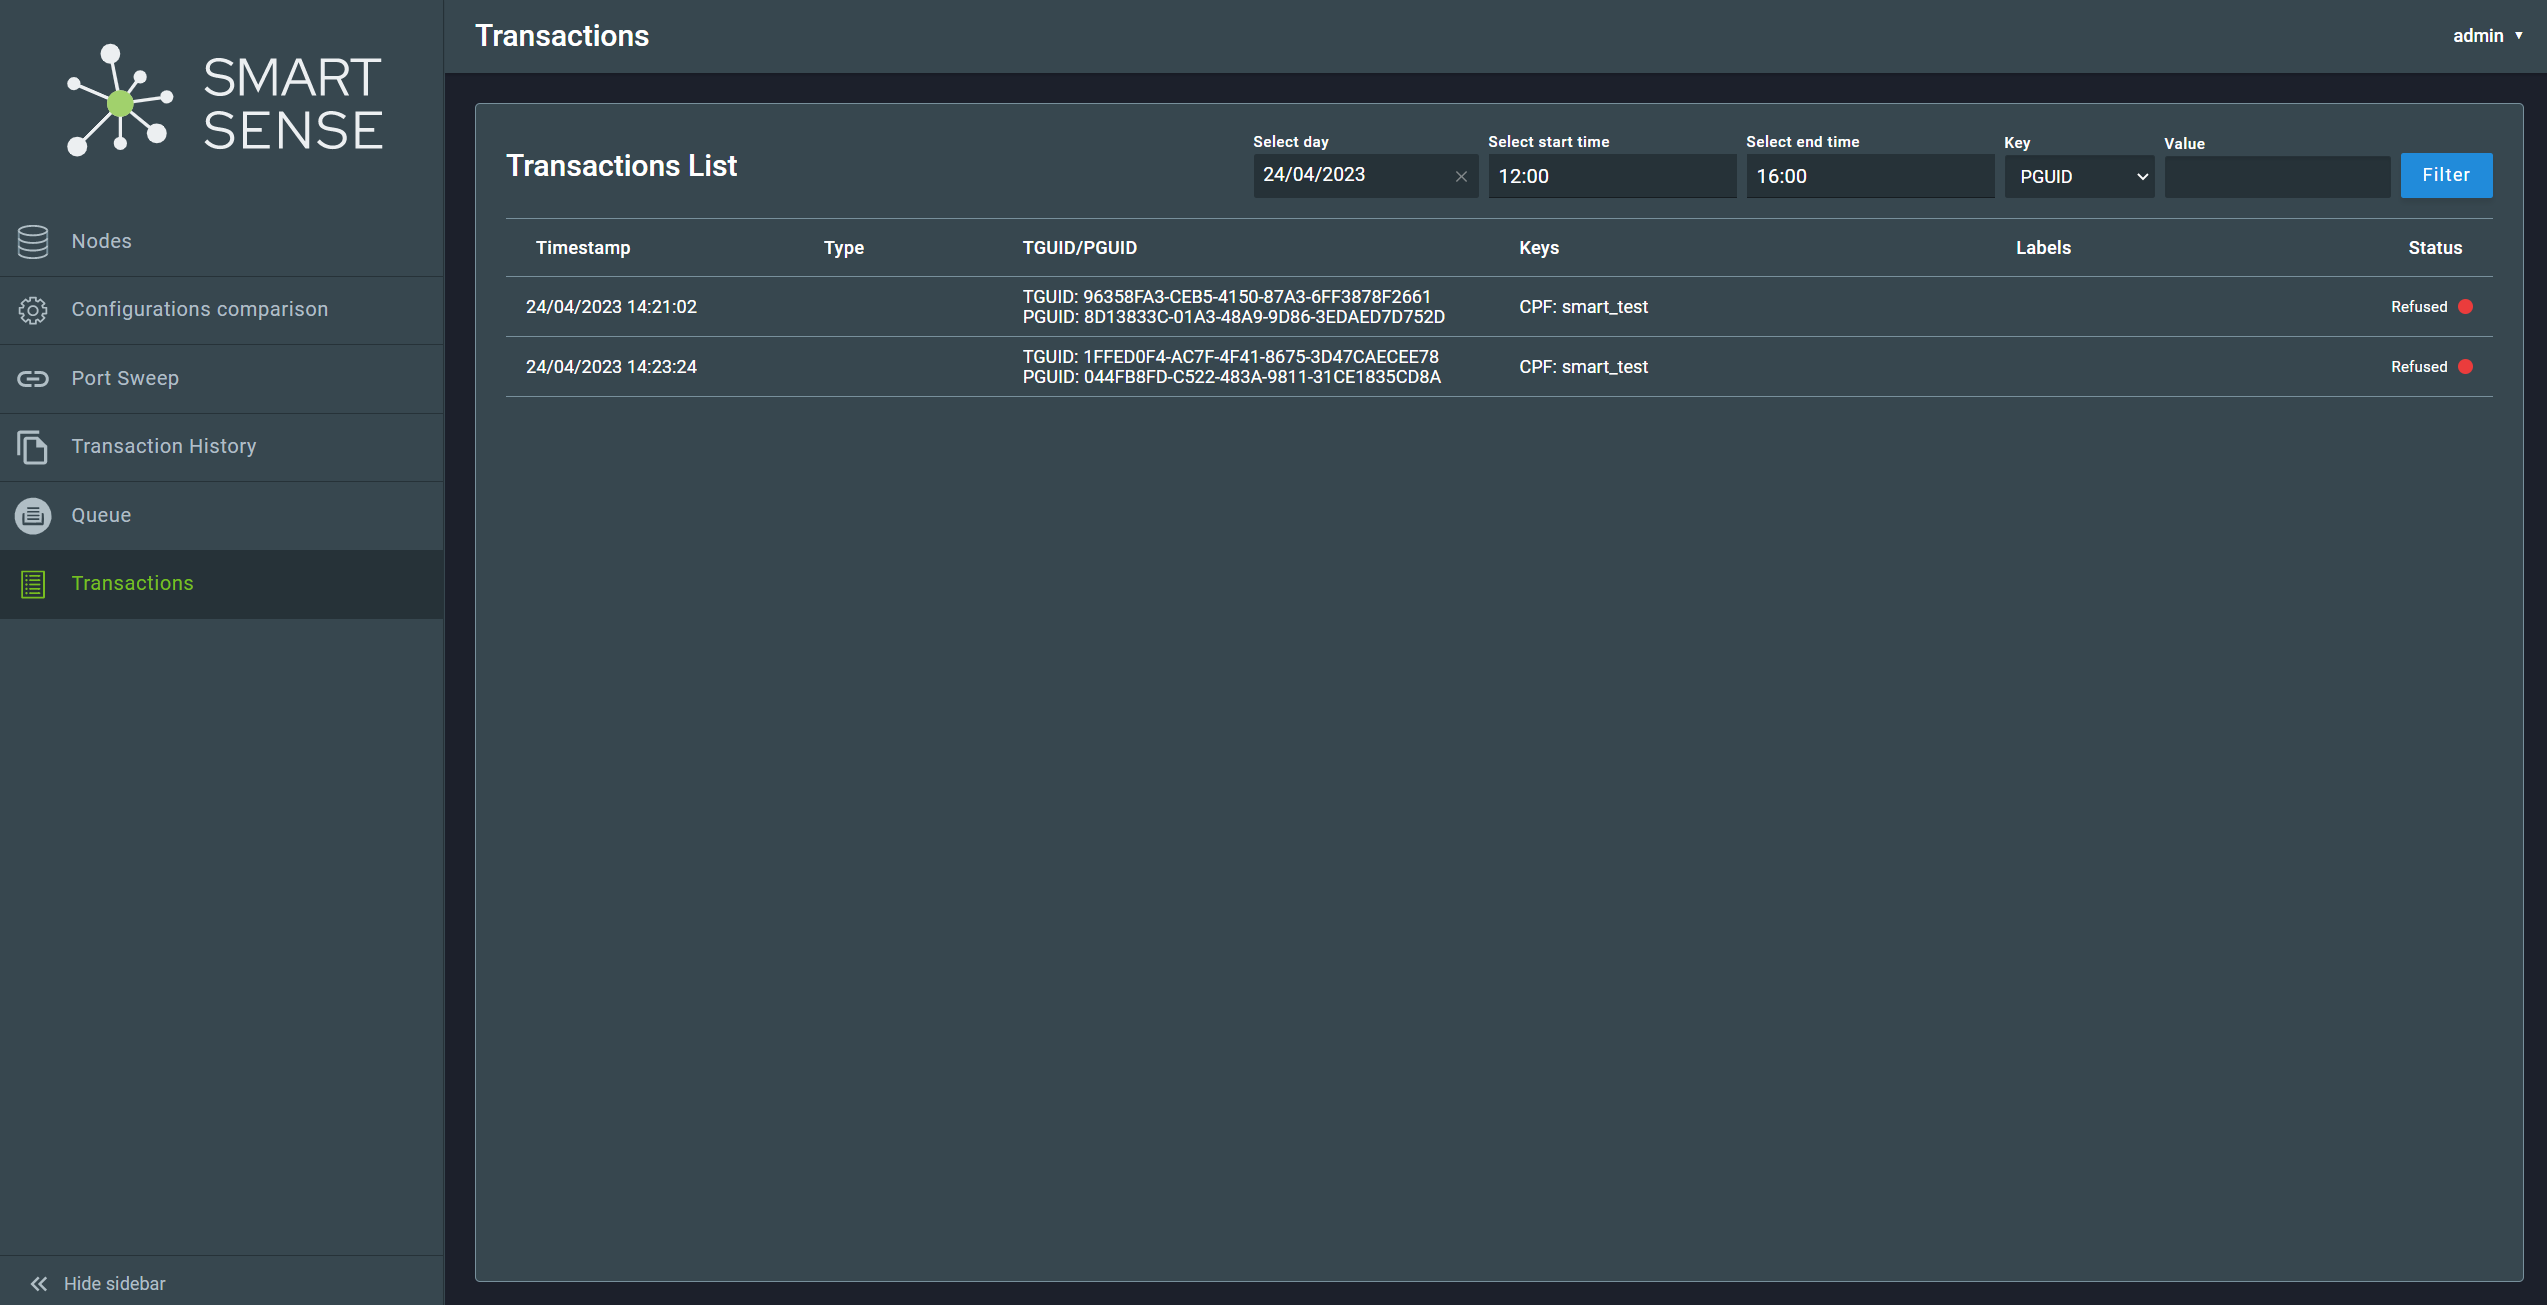
It is also possible to filter the transactions by PGUID, TGUID, label, key and biographic. To do so, use the the dropdown menu located on the upper-right corner of the screen to select the type of filter, fill in the Value field and then click on the Filter button.
For detailed information about a transaction, click an item of the list to show the Transaction Details screen:
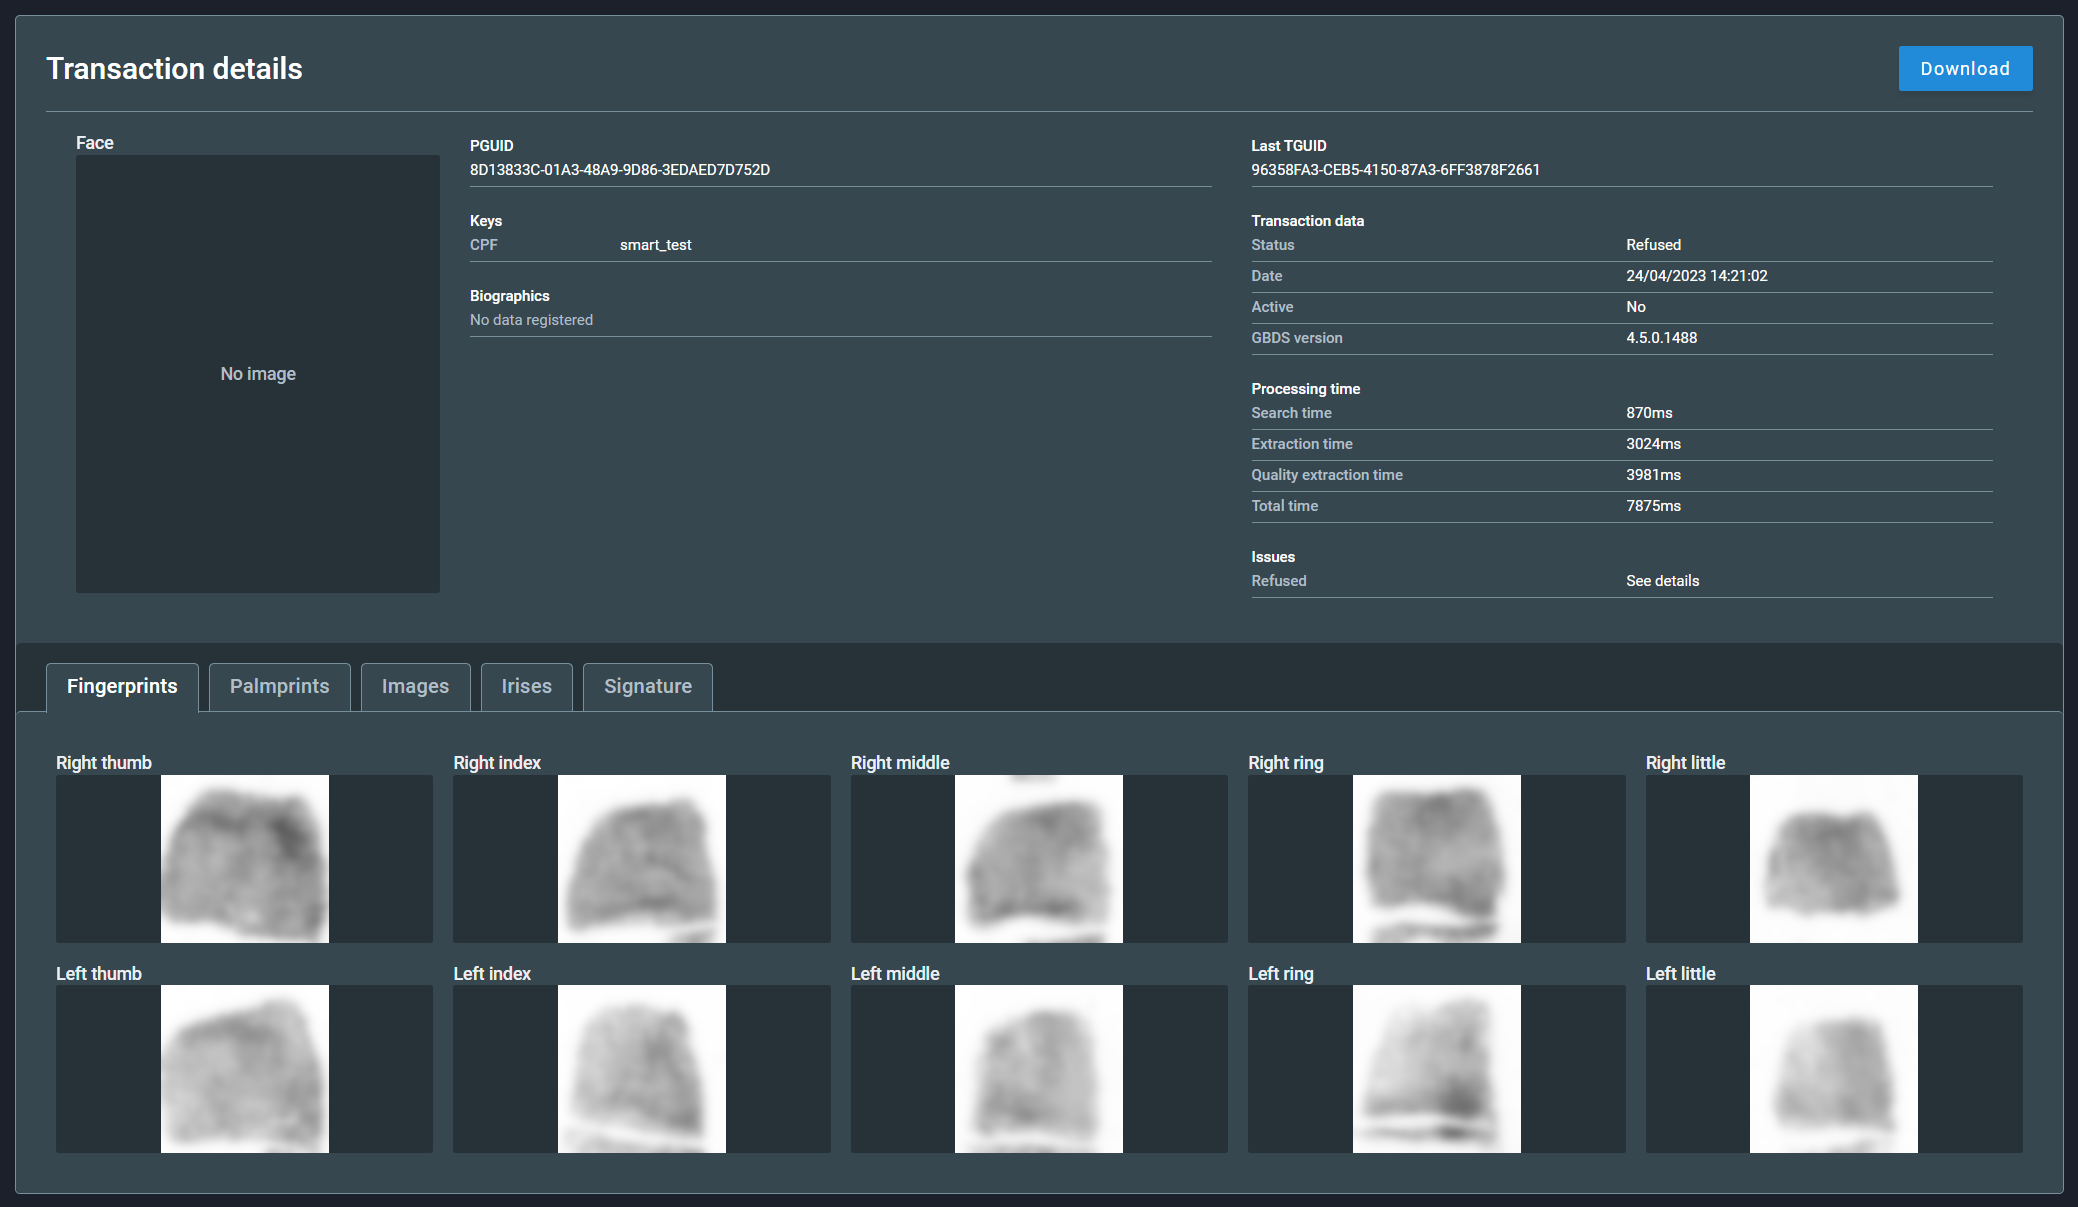
It is possible to download the biometric data of the transaction. To do so, click on the Download button, located on the upper-right corner of the screen. The download ZIP file will contain the images of the biometrics traits as well as the templates.
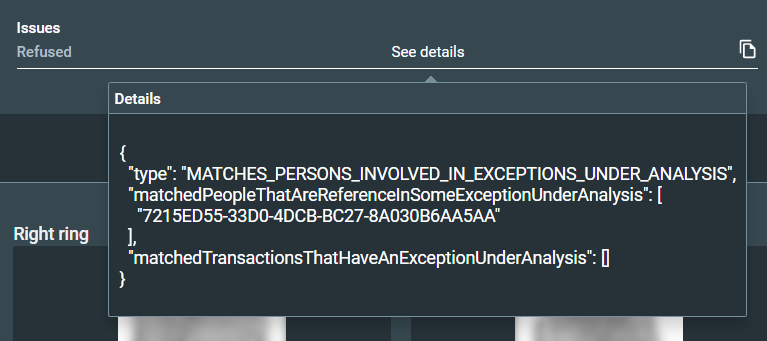
For more information on the transaction status, hover over See details on the right side of the screen, in the Issues section.
